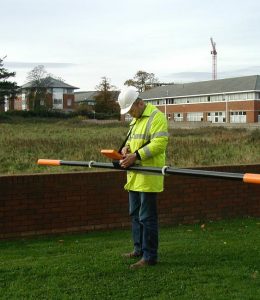
 Ground Conductivity Mapping is an electromagnetic technique used to investigate lateral variations in overburden material and variations in depth to bedrock. This EM31 survey technique (shown below) determines the apparent conductivity of the ground material from 0-6 m bgl. Ground Conductivity Mapping is an electromagnetic technique used to investigate lateral variations in overburden material and variations in depth to bedrock. This EM31 survey technique (shown below) determines the apparent conductivity of the ground material from 0-6 m bgl.
PRINCIPLES The survey involves the collection of data at either point locations or more commonly along profiles and/or grids. The two sets of readings are processed to determine the average conductivity, absolute conductivity difference, average in-phase and in-phase difference values. The processed data is displayed as line graphs and/or colour scale contoured plots. Variations in the average conductivity indicate changes in overburden material type and depth to bedrock. Low conductivity values would indicate shallow rock or dry sand and gravel deposits while higher conductivity values could indicate more clay rich overburden material, wet ground, buried services or fill. RESULTS
The survey results above show where shallow bedrock exists within an area of soft to firm silt/clay overburden. The areas of shallow bedrock are seen by areas of low conductivity (blue on the colour scale). |
Call us : 984187523XX
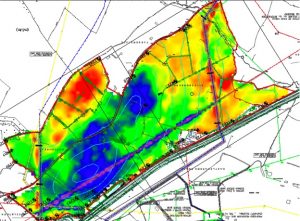 The results from a ground conductivity survey are normally presented as scaled contour maps as shown below to indicate how overburden thickness, lithology and cultural effects vary across the site. This gives a powerful overview of the site enabling effective classification of the site to target boreholes/trial pits or further more detailed geophysical survey techniques.